.png)
Let’s discuss three different options for debugging a firmware project, and the pros and cons of each.
UART
UART debugging has been around for a long time and is probably one of the earliest forms of debugging. UART debugging requires engineers to setup their UART peripheral in their firmware, and then use a function like {% c-line %}printf{% c-line-end %} or {% c-line %}putc{% c-line-end %} to send log information about the state of the program via UART.
The advantage of UART debugging is it requires very little hardware:
- MCU
- Two(2) or three (3) wires (RX, TX, GND) depending on if you also need to send data back to the device
- Dongle for transmitting that data to your laptop, which you can buy for $5.
All things considered it’s a pretty decent debugging tool for the cost. However it comes with some major drawbacks:
- If your design is already pin constrained, you have to give up 1 or 2 GPIO/peripheral pins that you might need for debugging
- Adding functions like {% c-line %}printf{% c-line-end %} increase your code size. If you are on a resource constrained MCU, this could be problematic. Even if you create a custom function that is more light weight than {% c-line %}printf{% c-line-end %} you still need to take into account the increase in code size and also data (RAM) size.
- Sending data over UART often requires involvement from the CPU since the CPU is needed for loading data into the UART transmit buffer. For long strings, this could result in noticeable lags in the program flow. It’s possible to get around this using DMA, but then instead of debugging your program, you’re spending time properly setting up DMA in your code. Depending on deadlines, this might not be optimal.

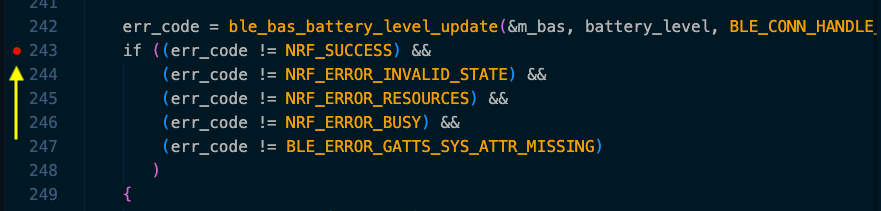
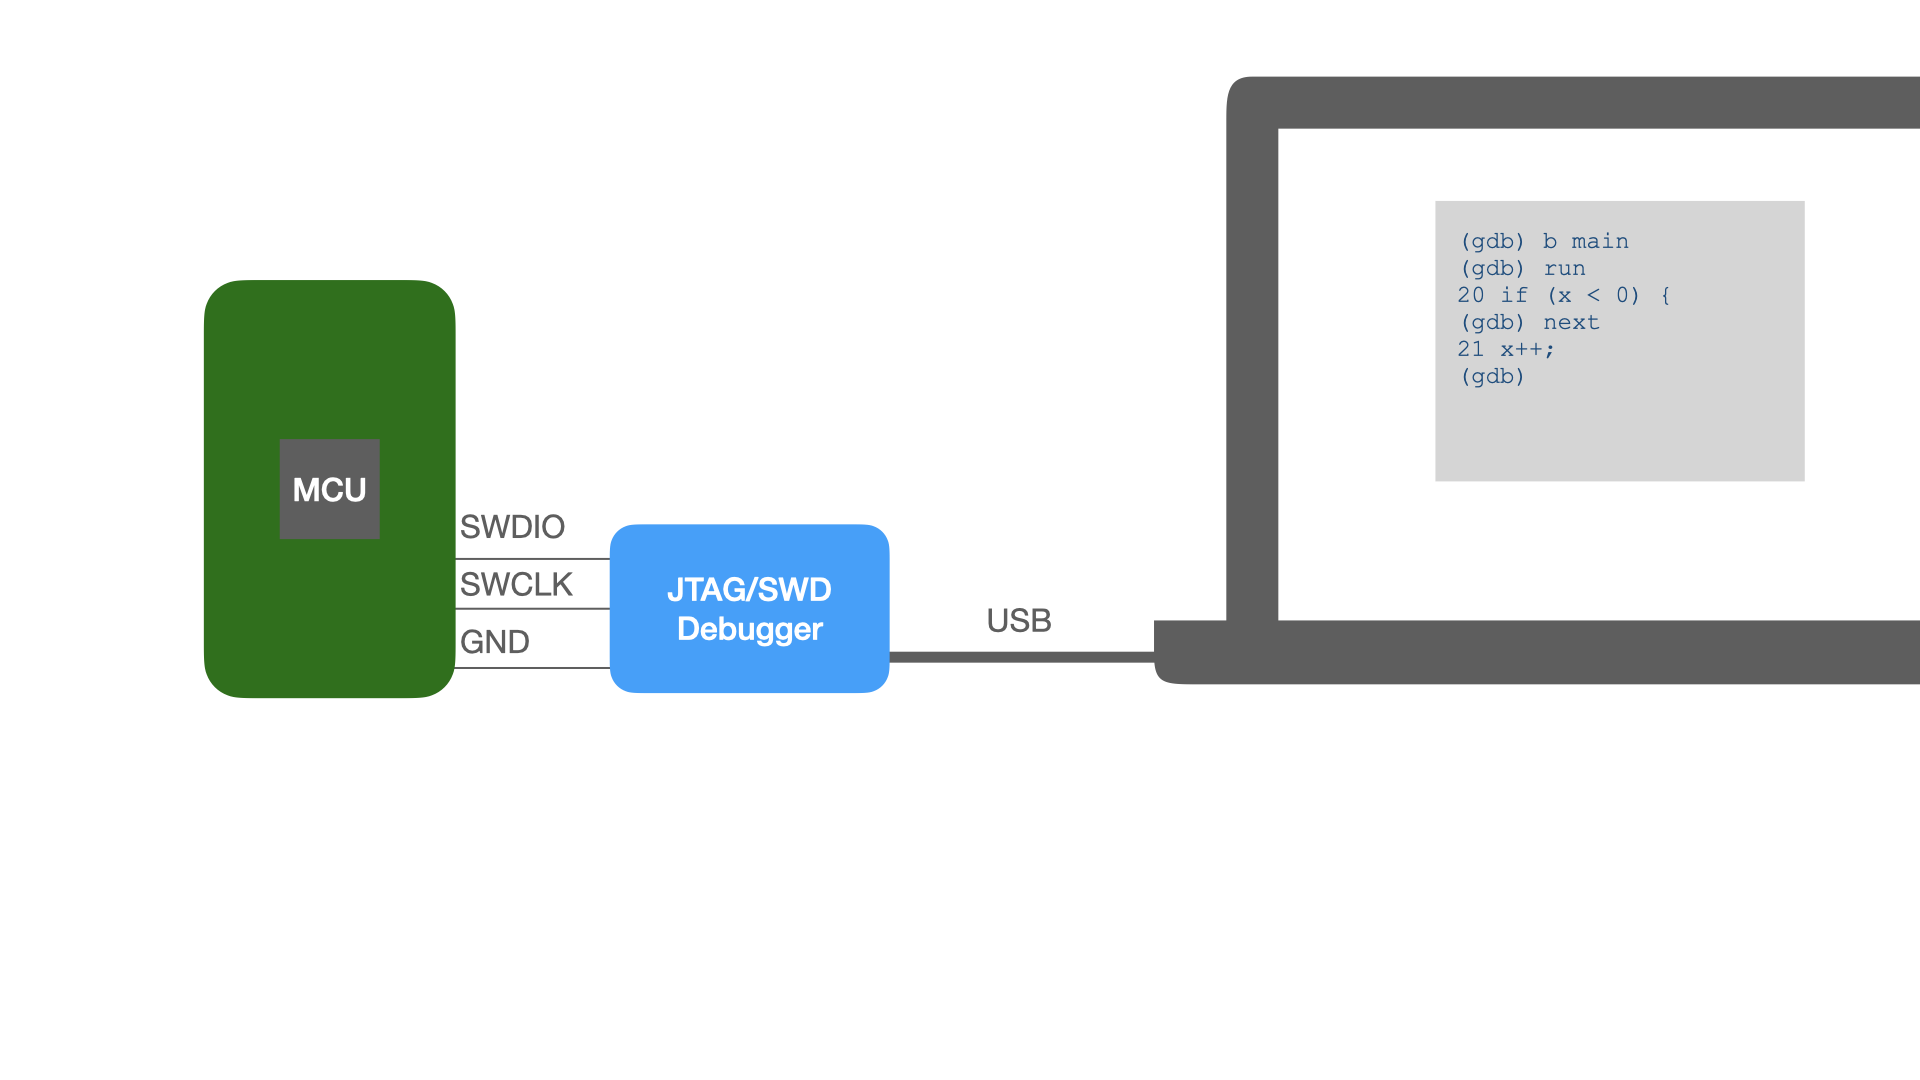
GDB
With the advent of the JTAG interface (and now SWD) engineers were given a significant upgrade in their debugging toolbox. GDB, or more generally breakpoint debugging, allows engineers to stop the program at specific points in the code and then step line by line through the program flow. This can be especially useful for investigating complicated algorithms or parsers, etc. When stopped, all variables in scope as well as global variables can be examined. If you’re debugging a multi-threaded application, e.g. Zephyr, FreeRTOS, it’s also possible to switch threads while the program is stopped, and examine variables in other threads.
In order to use GDB in an embedded system you’ll need a debug probe. These can range in price from very affordable to thousands of dollars. The plus side is that for chips with dedicated JTAG/SWD pins, using a debug probe does not use up any GPIO / peripheral pins on the MCU.
RTT
Real Time Transfer is a protocol developed by Segger. It is a fairly recent addition to the debugging toolbox. RTT takes pieces of both UART and GDB debugging. Like UART debugging, RTT debugging works by inserting special print functions in user code, e.g. {% c-line %}rtt_printf{% c-line-end %} which transmits data to the host. Unlike UART, it does not require any peripherals from the MCU and there is almost no CPU overhead.
When {% c-line %}rtt_printf{% c-line-end %} is called data gets written to a circular buffer at a specific block in RAM. Writing to RAM is a very fast operation, even for longer strings. The data is then read by a debug probe over the JTAG/SWD interface and transmitted back to the host. Because the JTAG/SWD pins are used to transmit data, no additional GPIO or peripheral pins are used.
Reach out to learn more about Lager's hardware test automation platform.
Try One Month Free
hello@lagerdata.com
