.png)
There are lots of reasons why you might need to remotely debug your firmware. Maybe the particular bug you're trying solve only rears its ugly head in the field. Maybe you're a remote employee and it's just not practical to always have hardware shipped to you. Or maybe you just really like working from your couch(I know I do!). Whatever the reason wouldn't it be nice if "remote debugging" felt just like debugging, no air quotes?
Fortunately there's an application that's been around for a while to let us do what we need called {% c-line %}gdbserver{% c-line-end %}. GDB (GNU Debugger) is a portable debugger that works with lots of languages, and is used a lot when debugging C applications. Historically {% c-line %}gdbserver{% c-line-end %} was meant for debugging system applications running on remote computers, not for debugging embedded systems. The reason is that firmware typically runs on bare-metal or on lightweight RTOS's. There isn't a full-blown OS underneath the firmware application that can run a program like {% c-line %}gdbserver{% c-line-end %}. For embedded systems, debugging happens via 3rd party software and debug probes like JLink, CMSIS-DAP, or ICD4 that connect your hardware to a host computer via USB. It's through this mechanism that embedded engineers are familiar with the process of debugging(e.g. with an IDE such as Eclipse, IAR, or Keil).
Luckily many of these debug probes support a version of {% c-line %}gdbserver{% c-line-end %} that allows a GDB Client(e.g. {% c-line %}arm-none-eabi-gdb{% c-line-end %} ) to remotely connect to your hardware. For example, if you're familiar with the J-Link tools you may have come across the program {% c-line %}JLinkGDBServer{% c-line-end %}. This is basically {% c-line %}gdbserver{% c-line-end %} that works with the J-Link debug probe. Similarly OpenOCD also supports a {% c-line %}gdbserver{% c-line-end %} that allows engineers to remotely debug embedded devices.
Remote Debugging Examples
To illustrate how this all ties together we'll present 2 examples, one using {% c-line %}JLinkGDBServer{% c-line-end %}, and one with {% c-line %}OpenOCD{% c-line-end %}.
JLinkGDBServer
Install the J-Link software on the remote computer that will connect to your hardware via the J-Link debug probe. This will install the {% c-line %}JLinkGDBServer{% c-line-end %} executable. Once installed plug in your J-Link debug probe into the remote computer via USB and into your board via JTAG/SWD
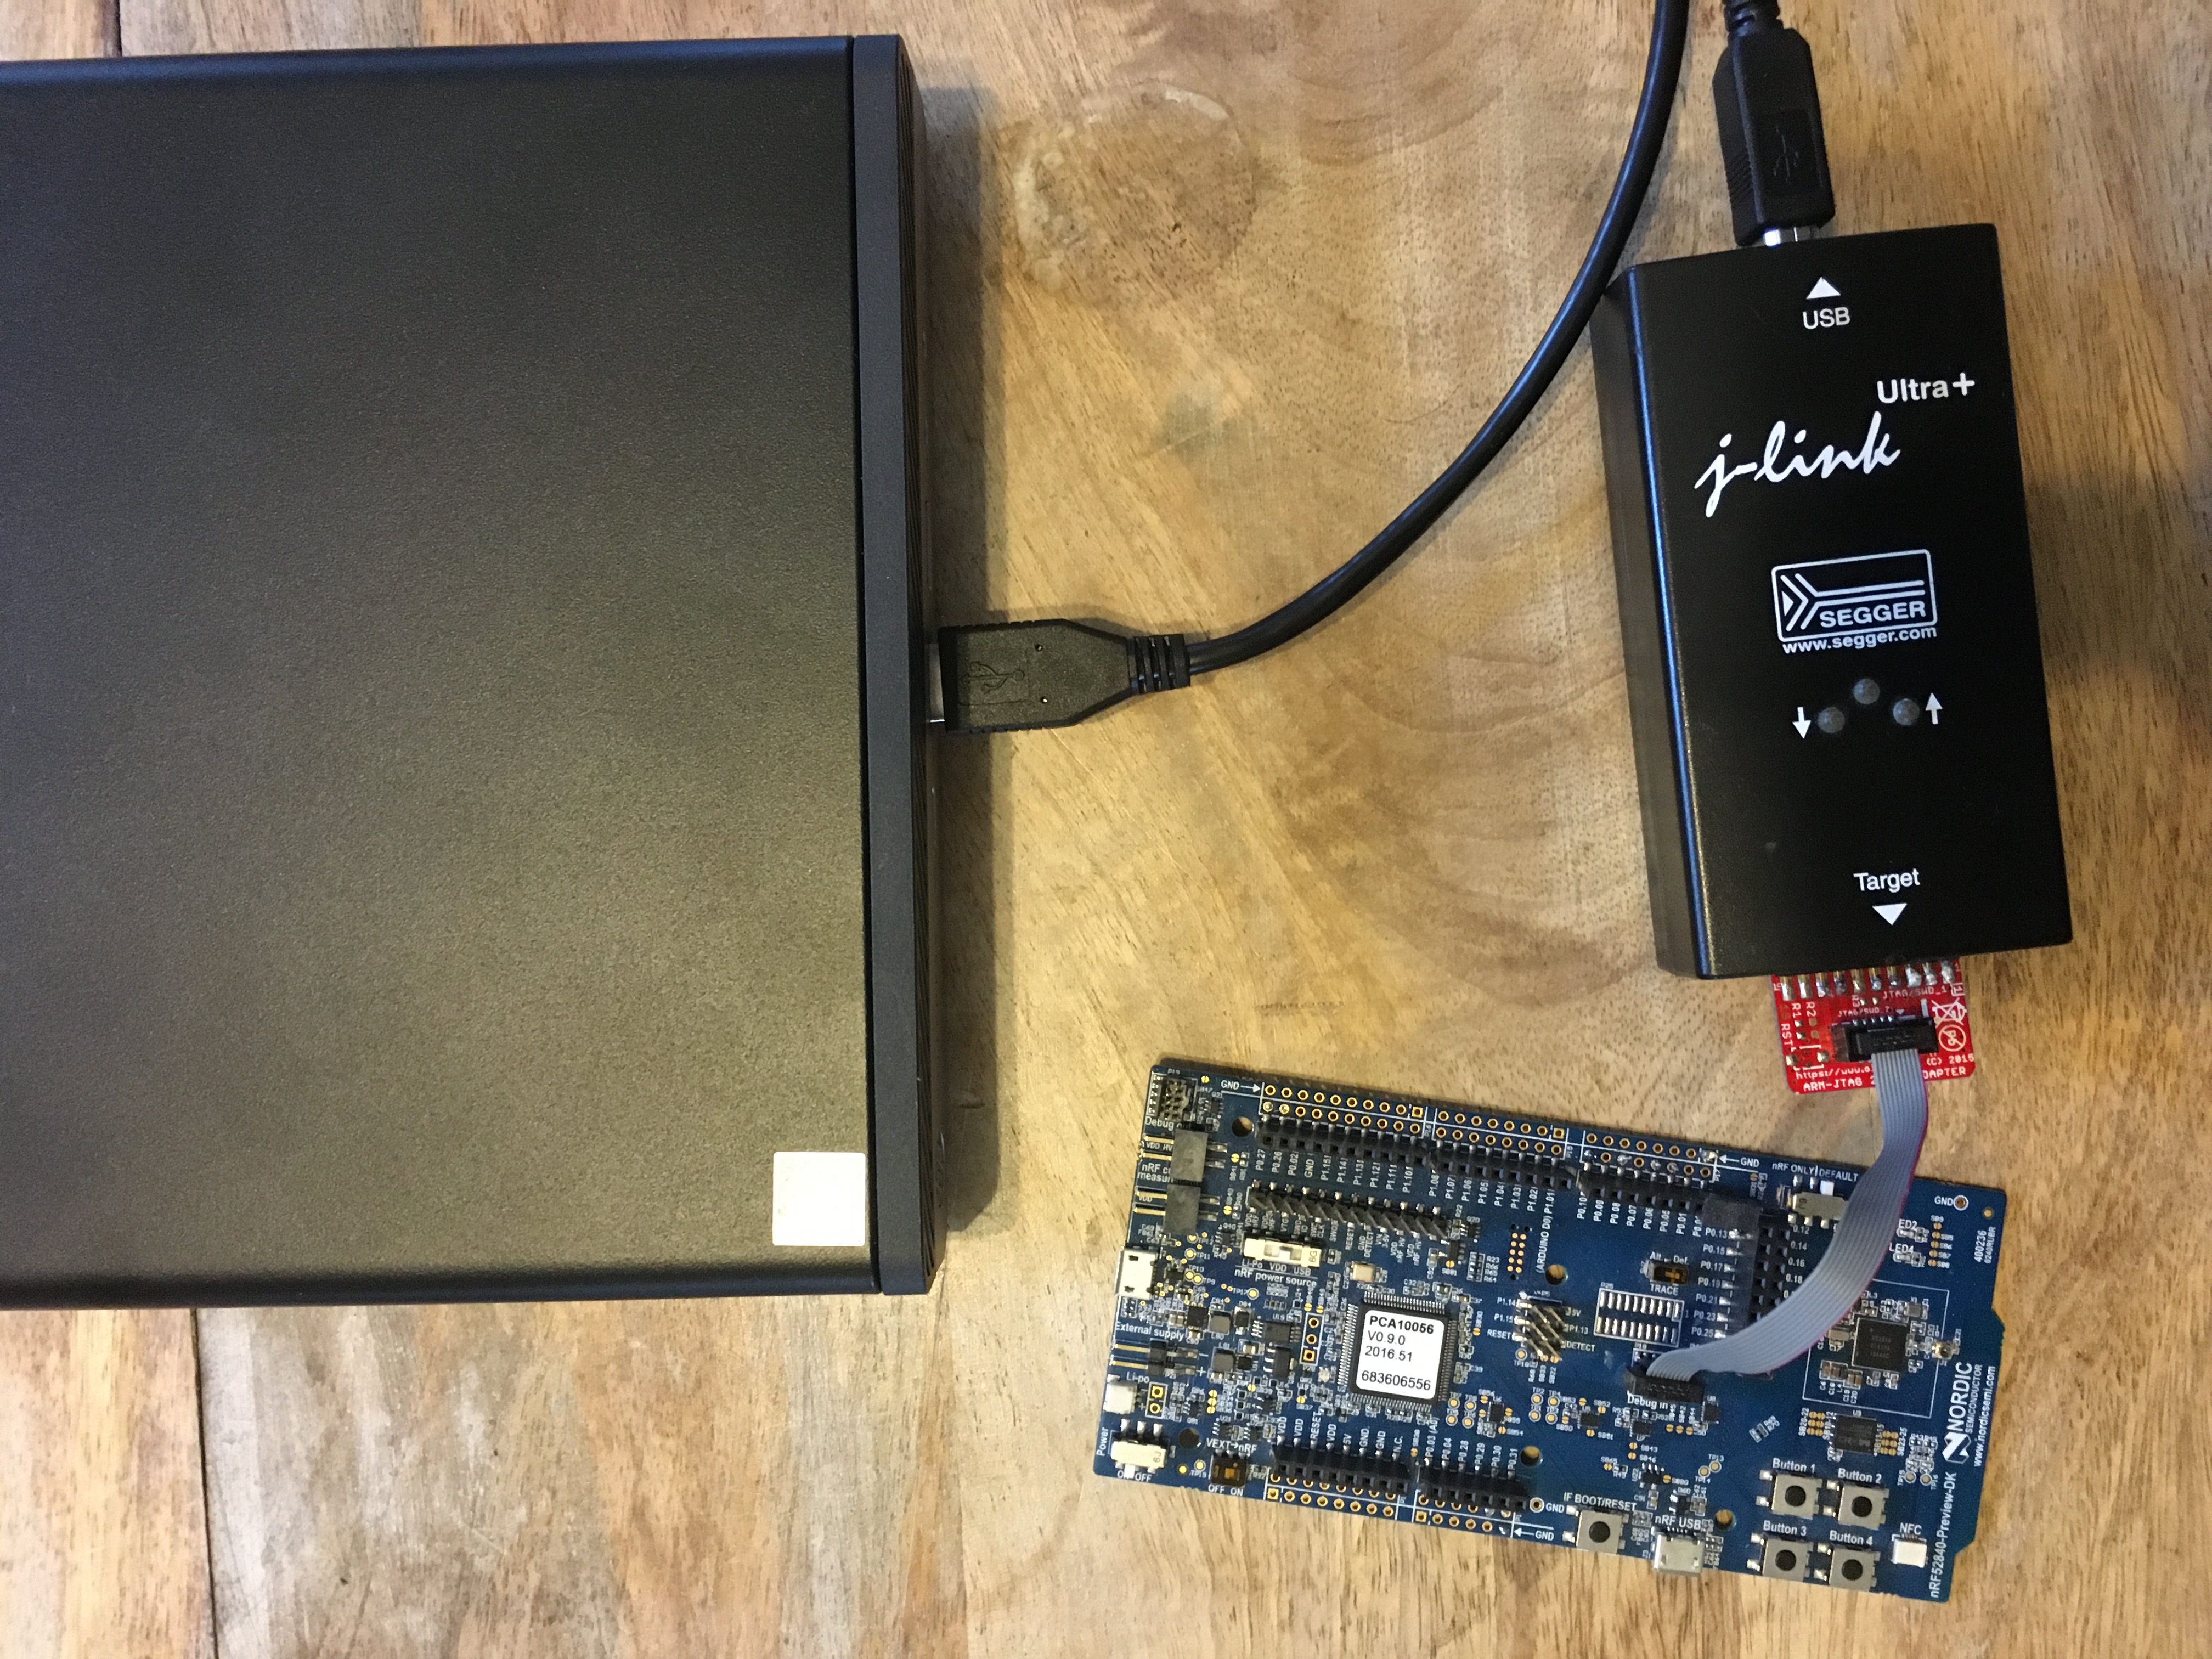
In this example we're going to use the nRF52-DK development board, so we're going to run the following on the remote computer:
{% c-block language="console" %}
% ./JLinkGDBServer -nolocalhostonly -ir -vd -halt -device NRF52 -if swd -speed 4000
SEGGER J-Link GDB Server V6.98 Command Line Version
JLinkARM.dll V6.98 (DLL compiled Mar 2 2021 15:55:51)
Command line: -nolocalhost -ir -vd -halt -device NRF52 -if swd -speed 4000
-----GDB Server start settings-----
GDBInit file: none
GDB Server Listening port: 2331
SWO raw output listening port: 2332
Terminal I/O port: 2333
Accept remote connection: yes
Generate logfile: off
Verify download: on
Init regs on start: on
Silent mode: off
Single run mode: off
Target connection timeout: 0 ms
------J-Link related settings------
J-Link Host interface: USB
J-Link script: none
J-Link settings file: none
------Target related settings------
Target device: NRF52
Target interface: SWD
Target interface speed: 4000kHz
Target endian: little
Connecting to J-Link...
J-Link is connected.
Firmware: J-Link OB-SAM3U128-V2-NordicSemi compiled Feb 2 2021 16:47:20
Hardware: V1.00
S/N: 683238674
Feature(s): RDI, FlashBP, FlashDL, JFlash, GDB
Checking target voltage...
Target voltage: 3.30 V
Listening on TCP/IP port 2331
Connecting to target...
Connected to target
Waiting for GDB connection...
{% c-block-end %}
*For more information on JLinkGDBServer flags see the J-Link user manual
The {% c-line %}-nolocalhostonly{% c-line-end %} flag tells the {% c-line %}JLinkGDBServer{% c-line-end %} application to listen for addresses other than {% c-line %}localhost{% c-line-end %}. This is what enables other computers to connect to it.
You'll also notice that {% c-line %}JLinkGDBServer{% c-line-end %} uses port {% c-line %}2331{% c-line-end %} so we'll need to make sure to use that port when connecting with {% c-line %}arm-none-eabi-gdb{% c-line-end %}, e.g. {% c-line %}target remote 192.168.86.69:2331{% c-line-end %}
If the remote computer is on the same WiFi network as your host computer, then life is easy. For example if your remote computer is on IP address 192.168.86.69 then to remotely connect to your hardware and start debugging it do the following:
{% c-block language="console" %}
%arm-none-eabi-gdb nrf52840_xxaa.out
Reading symbols from nrf52840_xxaa.out...
(gdb) target remote 192.168.86.69:2331
Remote debugging using 192.168.86.69:2331
0x00000000 in __isr_vector ()
(gdb) mon reset
Resetting target
(gdb) load
Loading section .text, size 0x714 lma 0x0
Loading section .ARM.exidx, size 0x8 lma 0x714
Loading section .data, size 0x6c lma 0x71c
Start address 0x2bc, load size 1928
Transfer rate: 31 KB/sec, 642 bytes/write.
(gdb) break main
Breakpoint 1 at 0x388: file ../../../main.c, line 62.
(gdb) c
Continuing.
Breakpoint 1, main () at ../../../main.c:62
62 bsp_board_init(BSP_INIT_LEDS);
(gdb) n
67 for (int i = 0; i < LEDS_NUMBER; i++)
(gdb)
{% c-block-end %}
If your remote computer is on a different WiFi network things get a little trickier, because you'll need to securely expose your remote computer to the internet. How to do that manually is outside the scope of this article, but you'll probably want to use something like tailscale.
OpenOCD
For the OpenOCD example we'll use the same Nordic nrf52-dk development board and J-Link debug probe (although you could use any number of debug probes supported by OpenOCD). To start the GDB server on the remote computer do:
{% c-block language="console" %}
% openocd -f interface/jlink.cfg -c "transport select swd" -c "adapter speed 4000" -c "bindto 0.0.0.0" -f target/nrf52.cfg
Open On-Chip Debugger 0.11.0-rc2+dev-g1098b72df-dirty (2021-03-10-16:21)
Licensed under GNU GPL v2
For bug reports, read
http://openocd.org/doc/doxygen/bugs.html
swd
adapter speed: 4000 kHz
Info : Listening on port 6666 for tcl connections
Info : Listening on port 4444 for telnet connections
Info : J-Link OB-SAM3U128-V2-NordicSemi compiled Feb 2 2021 16:47:20
Info : Hardware version: 1.00
Info : VTarget = 3.300 V
Info : clock speed 1000 kHz
Info : SWD DPIDR 0x2ba01477
Info : nrf52.cpu: hardware has 6 breakpoints, 4 watchpoints
Info : starting gdb server for nrf52.cpu on 3333
Info : Listening on port 3333 for gdb connections
{% c-block-end %}
You'll notice one of the strings passed to {% c-line %}openocd{% c-line-end %} is {% c-line %}bindto 0.0.0.0{% c-line-end %} This tells openocd to listen to any connection coming in on port {% c-line %}3333{% c-line-end %}. Again, if your host computer is on the same network as the remote computer running {% c-line %}openocd{% c-line-end %} life is easy if you know that computer's IP address:
{% c-block language="console" %}
%arm-none-eabi-gdb nrf52_xxaa.out
Reading symbols from nrf52840_xxaa.out...
(gdb) target remote 192.168.86.69:3333
Remote debugging using 192.168.86.69:3333
0x00000702 in delay_machine_code ()
(gdb) mon reset halt
target halted due to debug-request, current mode: Thread
xPSR: 0x01000000 pc: 0x000002bc msp: 0x20040000
(gdb) load
Loading section .text, size 0x714 lma 0x0
Loading section .ARM.exidx, size 0x8 lma 0x714
Loading section .data, size 0x6c lma 0x71c
Start address 0x2bc, load size 1928
Transfer rate: 3 KB/sec, 642 bytes/write.
(gdb) break main
Breakpoint 1 at 0x388: file ../../../main.c, line 62.
(gdb) c
Continuing.
Note: automatically using hardware breakpoints for read-only addresses.
Breakpoint 1, main () at ../../../main.c:62
62 bsp_board_init(BSP_INIT_LEDS);
(gdb) n
67 for (int i = 0; i < LEDS_NUMBER; i++)
(gdb)
{% c-block-end %}
Warning
In the above two examples by using {% c-line %}-nolocalhostonly{% c-line-end %} for {% c-line %}JLinkGDBServer{% c-line-end %} or {% c-line %}bindto 0.0.0.0{% c-line-end %} for {% c-line %}openocd{% c-line-end %} you're exposing your hardware and debugger to ANY computer which can reach yours via the network. This means potentially the entire internet! This can be extremely dangerous, so you must be sure that the computer is properly firewalled or behind a NAT if you only intend to access it from the local network. Ultimately this is suitable for one-off testing but is not suitable for ongoing use or a production-grade replacement for a proper VPN.
Lager
A third option for remotely debugging firmware that solves the issue of how to safely and securely expose your hardware to the internet is to use Lager Data. Lager also abstracts away the issue of whether or not your hardware is on a local network, or a network half-way across the world. In both cases it will work the same. We also provide and manage a VPN so that only authorized computers can connect to your hardware.
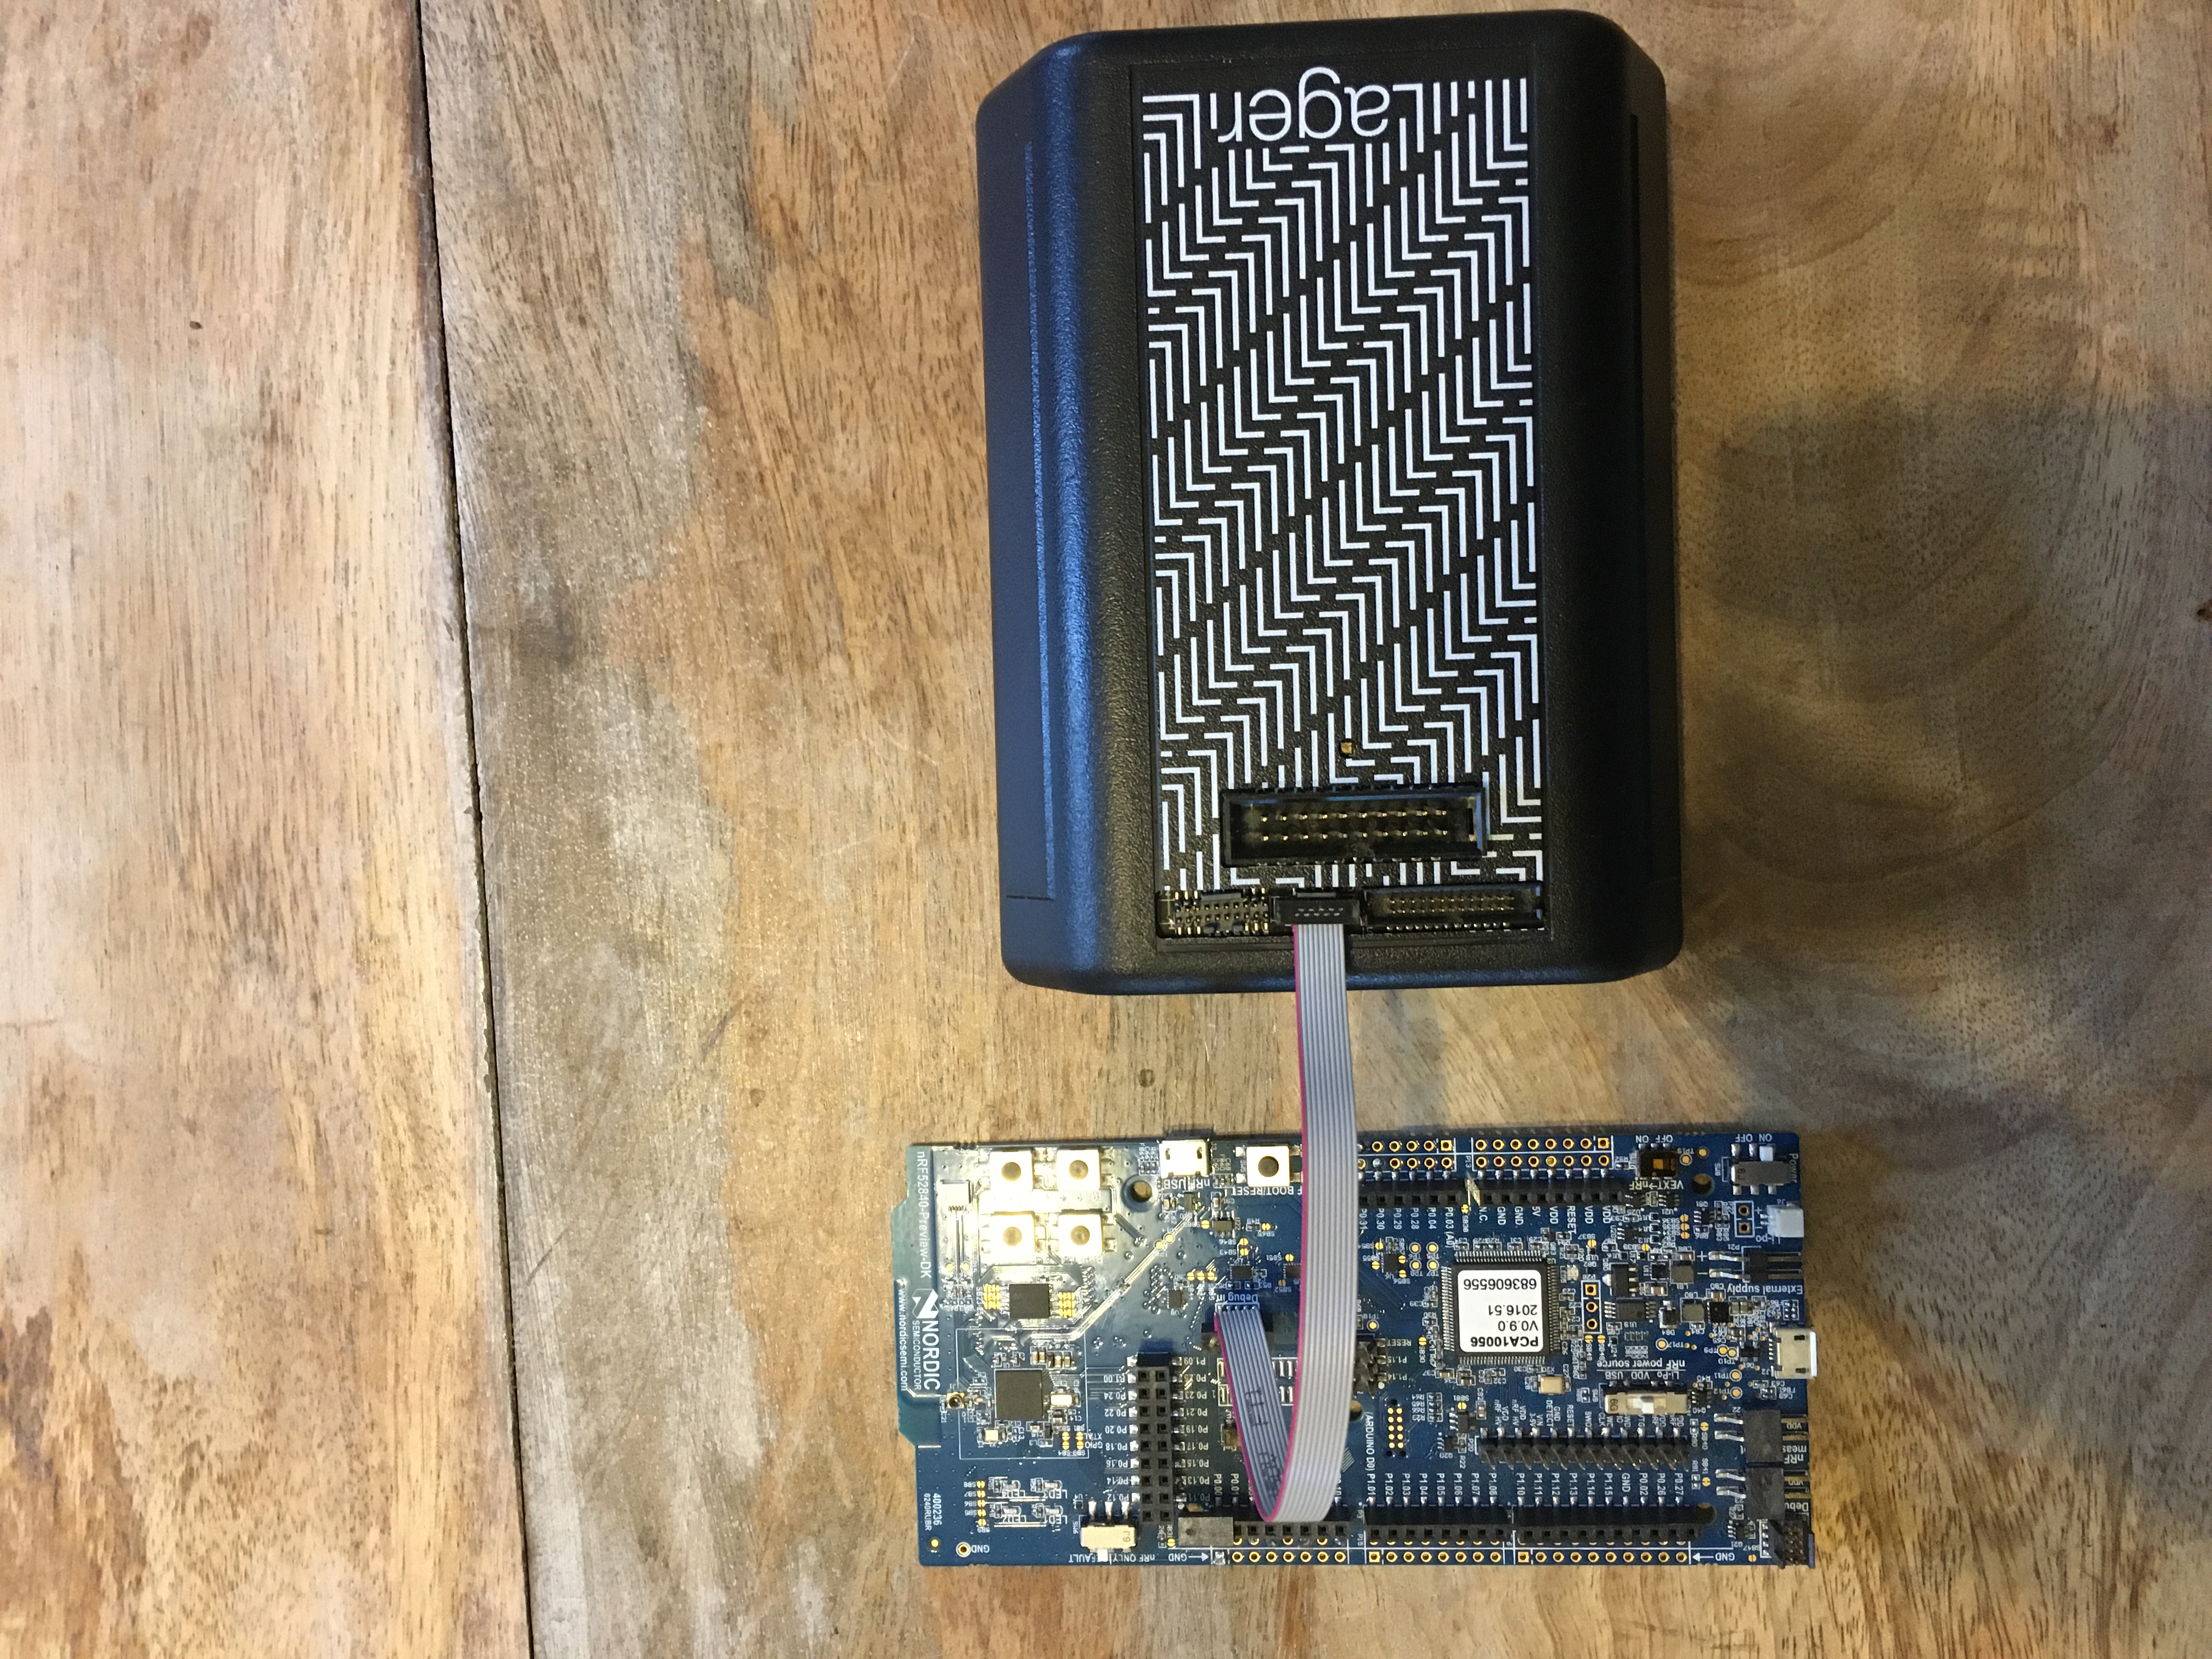
To start first connect the Lager Gateway to your device via the Lager Gateway's JTAG/SWD connector. Then from a terminal window on your host machine run:
{% c-block language="console" %}
% lager connect --device nrf52
Connected!
% lager gdbserver
Serving GDB on localhost:3333. Press Ctrl+C to quit.
{% c-block-end %}
From a different terminal window, also on your host machine, run the following:
{% c-block language="console" %}
%arm-none-eabi-gdb nrf52840_xxaa.out
Reading symbols from nrf52840_xxaa.out...
(gdb) target remote localhost:3333
Remote debugging using localhost:3333
main () at ../../../main.c:67
67 for (int i = 0; i < LEDS_NUMBER; i++)
(gdb) mon reset halt
target halted due to debug-request, current mode: Thread
xPSR: 0x01000000 pc: 0x000002bc msp: 0x20040000
(gdb) load
Loading section .text, size 0x714 lma 0x0
Loading section .ARM.exidx, size 0x8 lma 0x714
Loading section .data, size 0x6c lma 0x71c
Start address 0x2bc, load size 1928
Transfer rate: 2 KB/sec, 642 bytes/write.
(gdb) break main
Breakpoint 1 at 0x388: file ../../../main.c, line 62.
(gdb) c
Continuing.
Note: automatically using hardware breakpoints for read-only addresses.
Breakpoint 1, main () at ../../../main.c:62
62 bsp_board_init(BSP_INIT_LEDS);
(gdb) n
67 for (int i = 0; i < LEDS_NUMBER; i++)
(gdb)
{% c-block-end %}
The nice thing about remotely debugging with Lager is that you don't have to worry about figuring out the IP address of a remote computer, or how to expose that IP to the internet if you're not on the same network as your host computer. Regardless of where your hardware is located you'll always connect via <% c-line %>localhost<% c-line-end %> when debugging.
.svg)
